


Azure Spring Clean 2020 - Azure Resource Graph
A Quick Thank You
Firstly, before we get started I want to say a huge thanks to Joe Carlyle and Thomas Thornton for arranging and organising this event.
We all know these events take a huge amount of effort in planning and making them become a reality, so congratulations off to your both!
Yet again, another great example of the awesome #AzureFamily in action! Get Involved!
Azure Resource Graph Overview
The Azure Resource Graph is a service provided by Azure, based on the Kusto Query Language (KQL), that allow you to query quickly and efficiently across one or many subscriptions to explore resources and their properties within your Azure environment.
The Azure Portal’s search bar and the ‘All Resources’ blade are all powered by Azure Resource Graph as well as the new Change History feature that has been released in the past few months.
So it is likely you have been already utilising it without knowing so!
In my opinion it’s the best tool for digging into and discovering what resources, or properties of a set of resources, are in your Azure Subscriptions at speed!
It’s purpose built for this task so it makes it much more attractive to use over PowerShell or AZ CLI in my opinion.
It also supports Azure Delegated Resource Management (Azure Lighthouse), so for MSPs/Partners this is a great benefit to query all your customers at scale and speed!
How Does It Work Behind The Scenes?
Azure Resource Graph works by keeping a cached copy of your resources and their properties within a few Log Analytics tables; however you don’t have to deploy a Log Analytics Workspace and configure this, its all automatic and more importantly, free!
These tables get updated by the Azure Resource Manager every time a resource is created, updated or deleted by yourself or others. It also regularly performs full scans of your resources to ensure nothing is missed.
Microsoft aim to get 95% of resource changes into Resource Graph within 1 minute of the change completion
The frequency of the full scans is not currently known or documented
Kusto Query Language - KQL
Kusto Query Language (KQL) is the language that the Azure Resource Graph query language is based upon. KQL is very, very similar to T-SQL, so for any SQL DBAs out there, you should find this pretty easy to get off the ground with also.
If you are used to using Azure Monitor/Log Analytics to search through logs and create alerts, then you’ll likely be just fine with using Azure Resource Graph.
However, if this is your first time using KQL then below are links to a few resources to help you learn the basics of the query language:
- KQL Overview Docs - https://docs.microsoft.com/en-us/azure/kusto/query/
- KQL Tutorial - https://docs.microsoft.com/en-us/azure/kusto/query/tutorial?pivots=azuredataexplorer
- Azure Resource Graph Query Language Docs - https://docs.microsoft.com/en-us/azure/governance/resource-graph/concepts/query-language
- FREE Pluarlsight Course - https://www.pluralsight.com/courses/kusto-query-language-kql-from-scratch
- FREE demo Log Analytics Workspace with sample data to run KQL queries against - https://portal.azure.com/#blade/Microsoft_Azure_Monitoring_Logs/DemoLogsBlade
Resource Graph Explorer & Queries
These are 2 new blades/sections to the Azure Portal to help you both construct, store and share your Azure Resource Graph queries that you create.
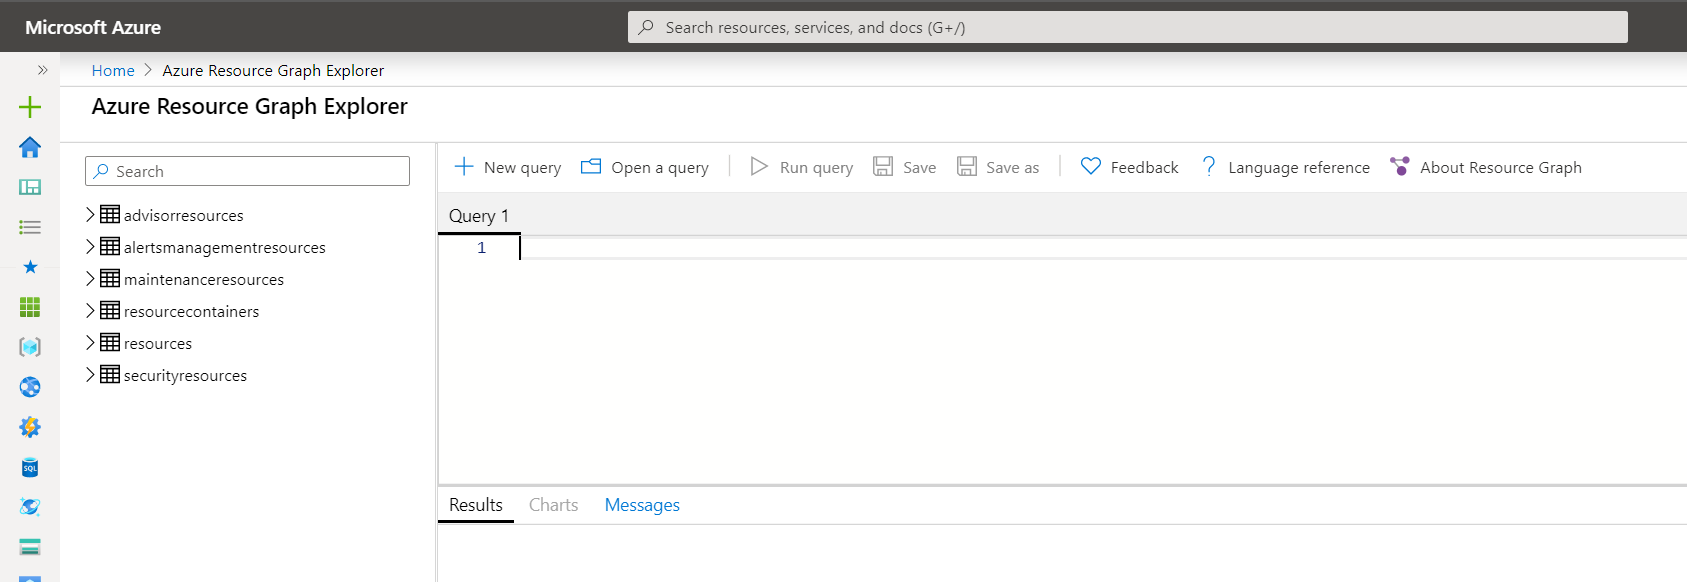
Azure Resource Graph Explorer

Azure Resource Graph Explorer has been great for me personally, as I found using Azure Resource Graph via PowerShell or AZ CLI a little clunky in the past to just look for information about resources etc…
With the Azure Resource Graph Explorer you can easily construct and build your own queries with a intuitive and graphical interface. You also get a small amount of help on syntax from IntelliSense/Code. You can then instantly run the queries you create and see their outputs.
It’s a great place to get your query built, tested and working. You can then save them from their for future use or pin them to a dashboard; more on this later!
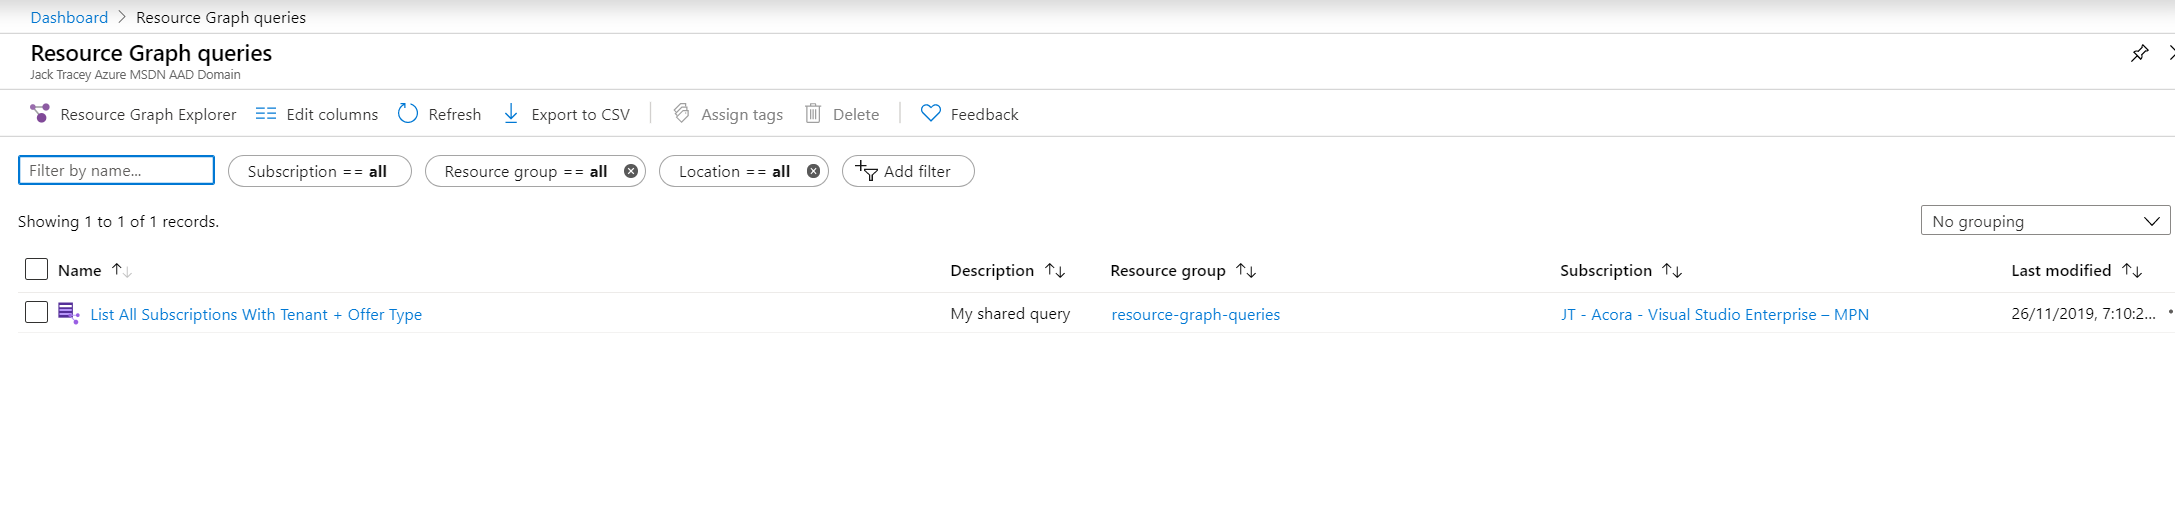
Azure Resource Graph Queries

Azure Resource Graph Queries is another blade in the portal where all of your saved queries are stored. You can even share them with other users if you wish too.
Getting Started - Running Your First Query
Microsoft have helpfully documented a lot of starter & some advanced queries to help you get started.
- Starter Queries - https://docs.microsoft.com/en-us/azure/governance/resource-graph/samples/starter?tabs=azure-cli
- Advanced Queries - https://docs.microsoft.com/en-us/azure/governance/resource-graph/samples/advanced?tabs=azure-cli
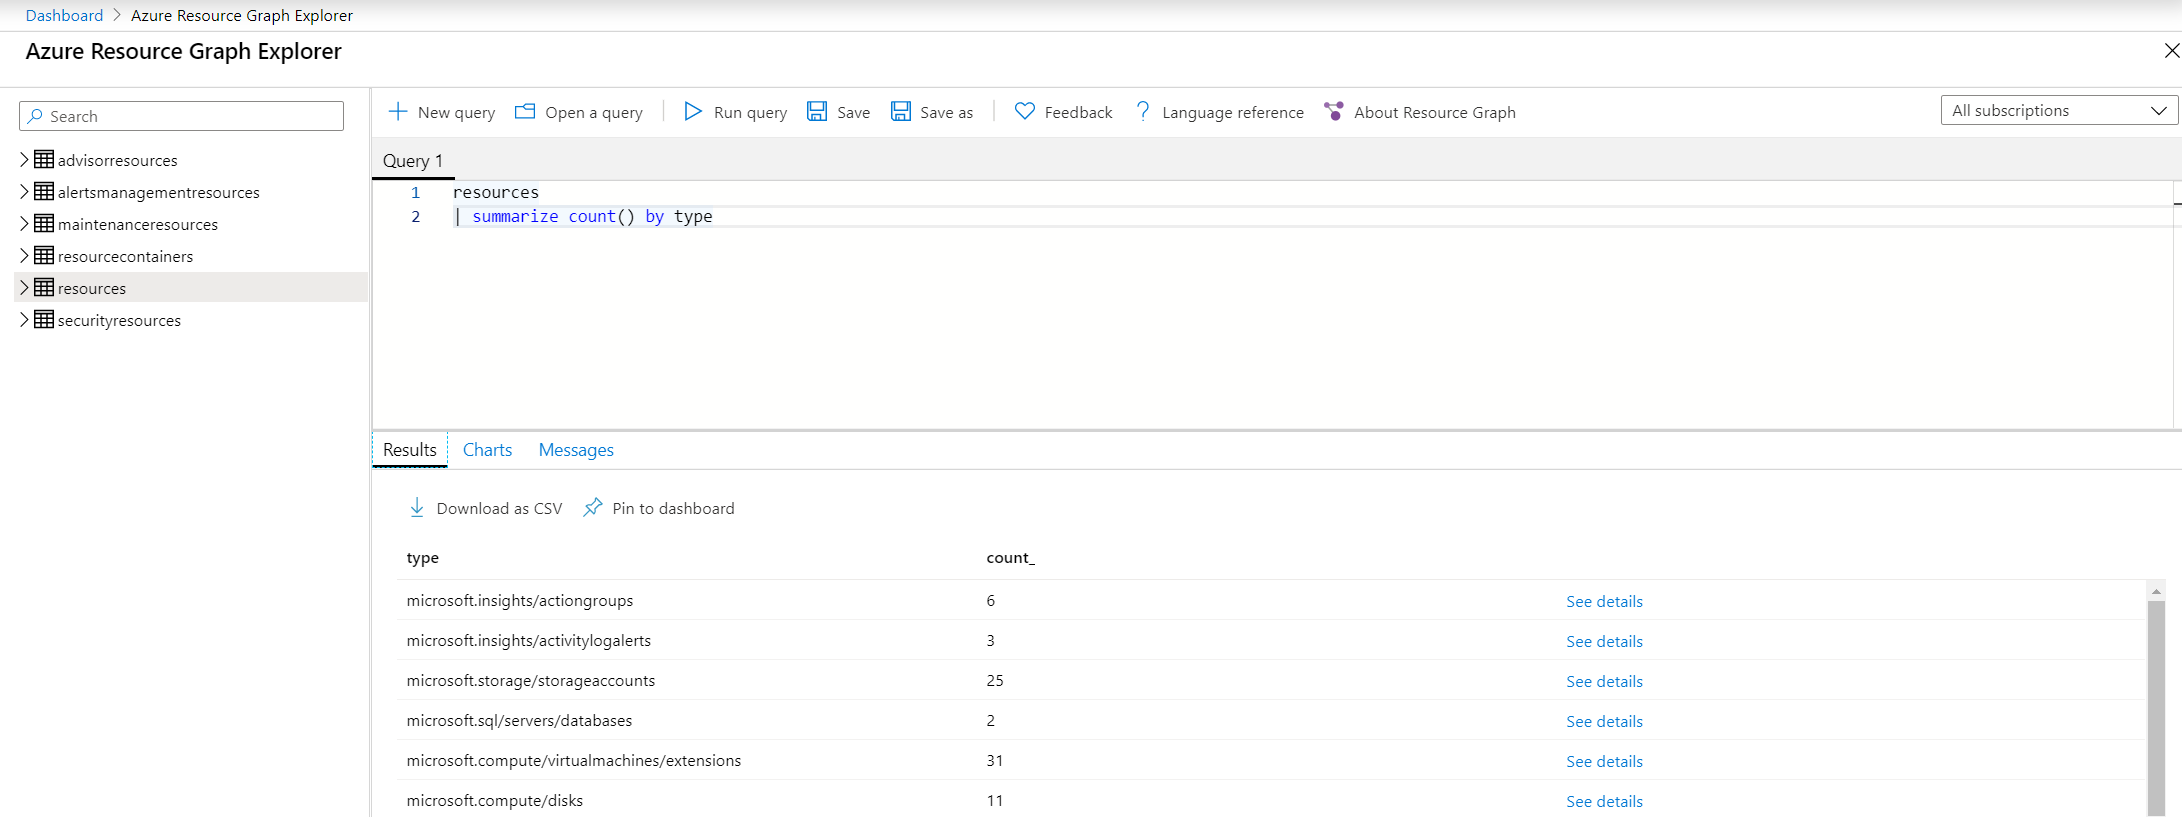
So get logged into the Azure Portal, open the Azure Resource Graph Explorer blade or click here and open the ‘Starter Queries’ docs page and lets walk through running your first query!
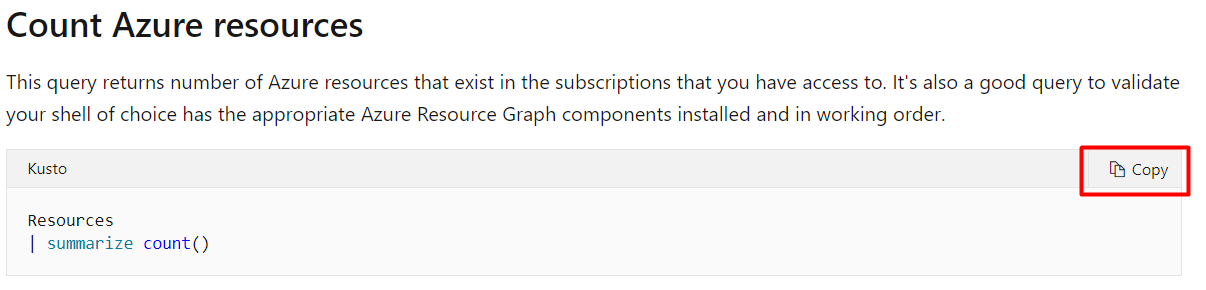
- Okay so you should currently be at this screen in the Azure Portal
- From the ‘Starter Queries’ docs page copy the first example query
- Paste it into the Resource Graph Explorer Query page
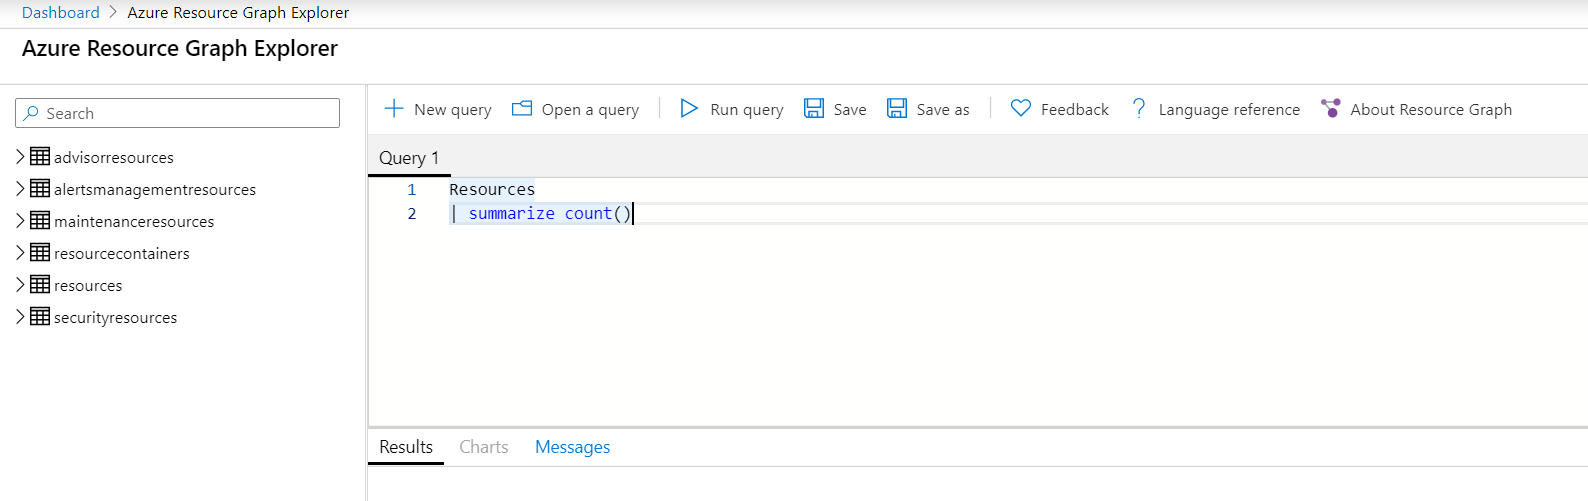
- Select the query, it will get highlighted in blue, then press ‘Run Query’ and look at the results
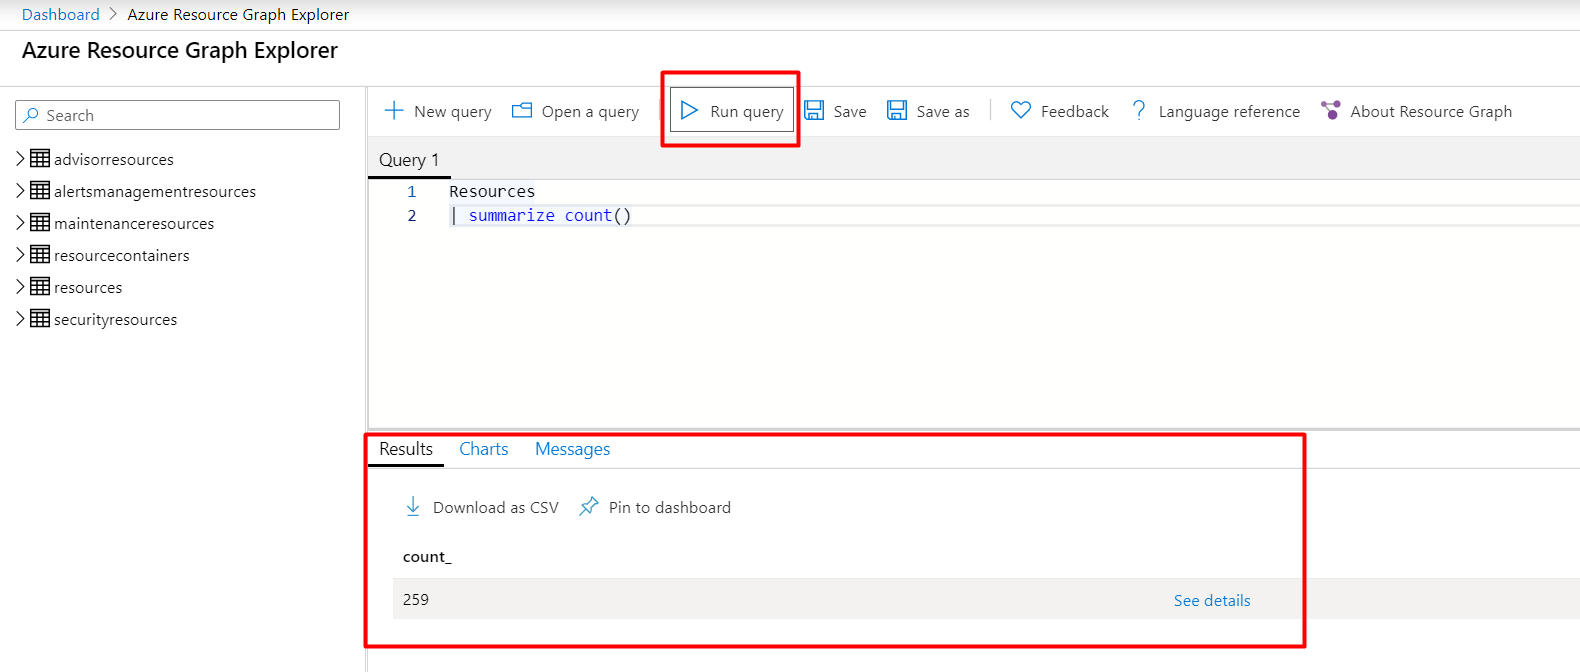
Easy, right?!
Let’s make it a little more powerful and pretty, with a few additions to the query:
- Add “by type” to the end of the query on line 2, the complete query would be:
Resources
| summarize count() by type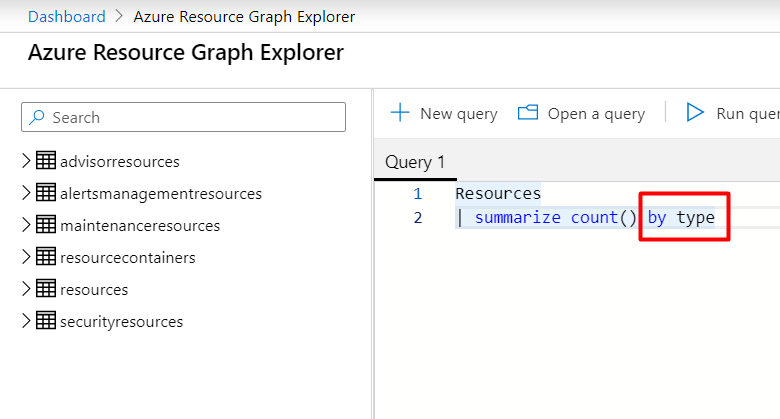
- Press ‘Run Query’ again and look at the new results that have been output
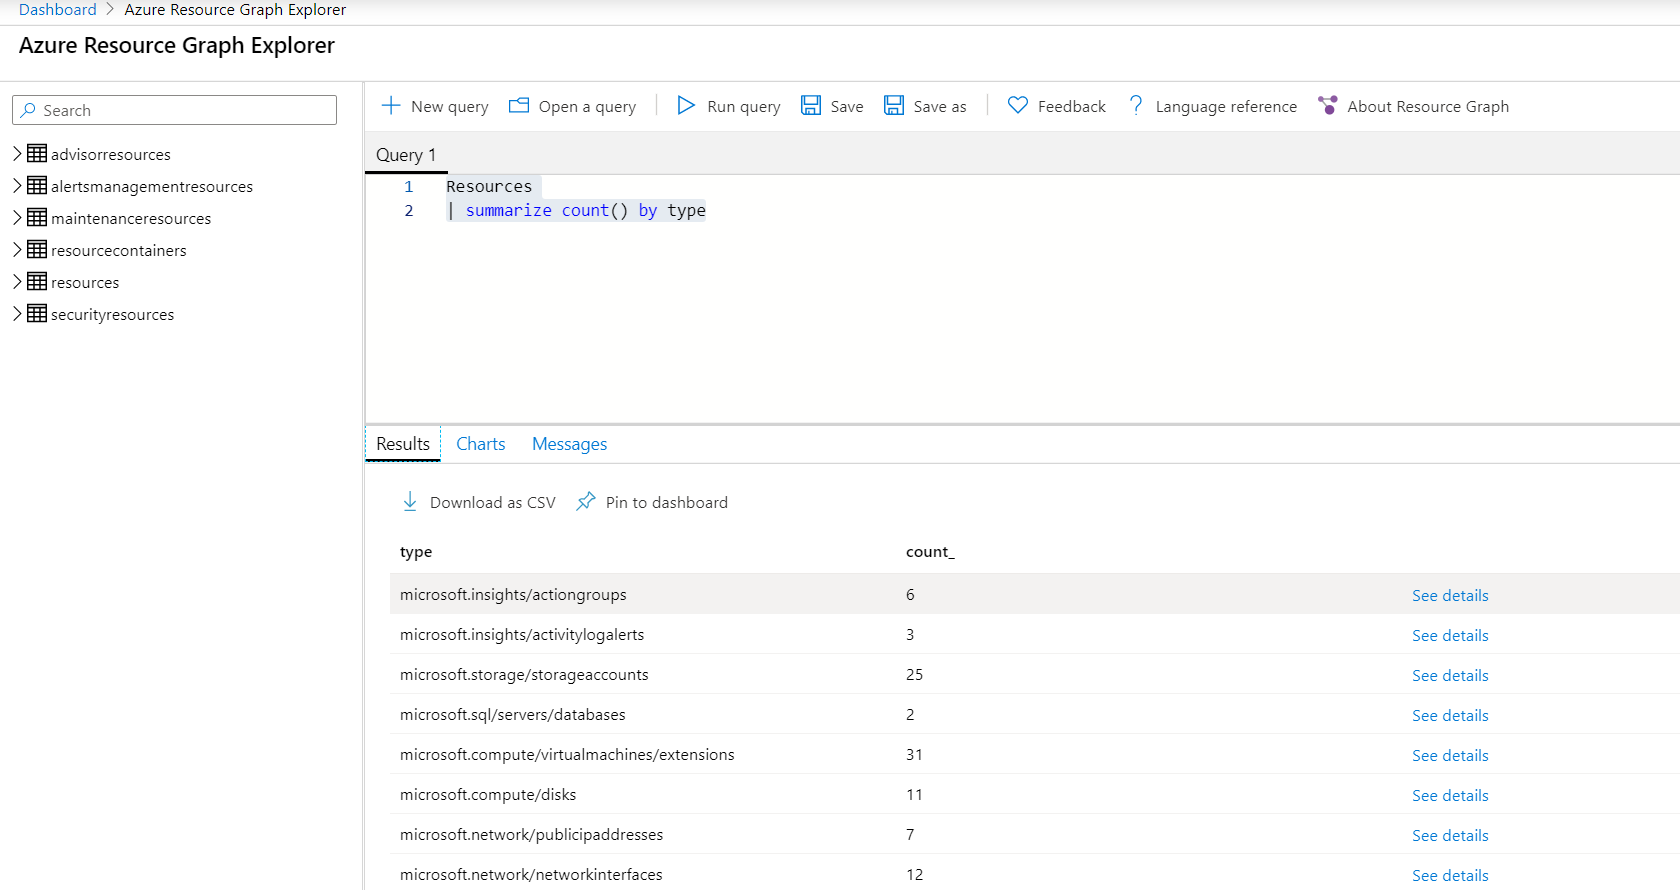
We are now seeing the count of all resources that I have access to see, grouped by the Resource Type property
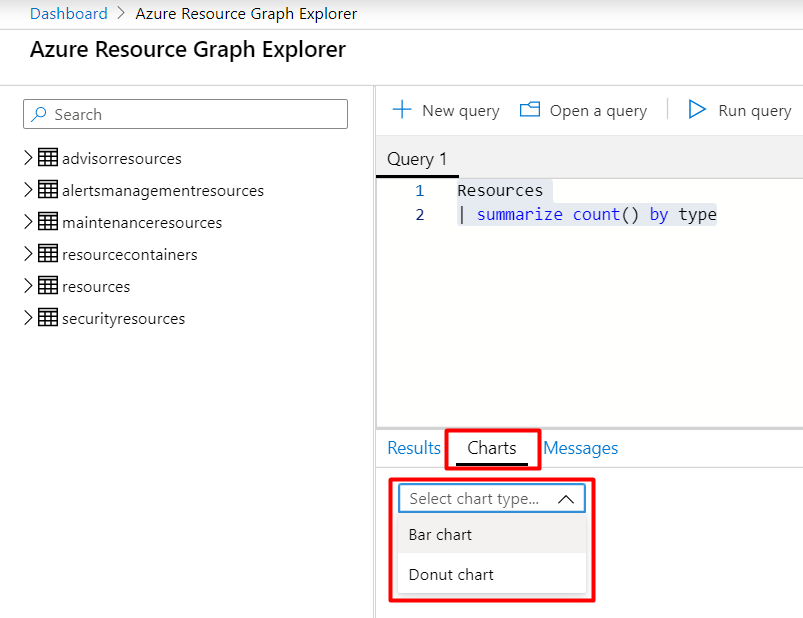
Okay that’s powerful, but not very pretty
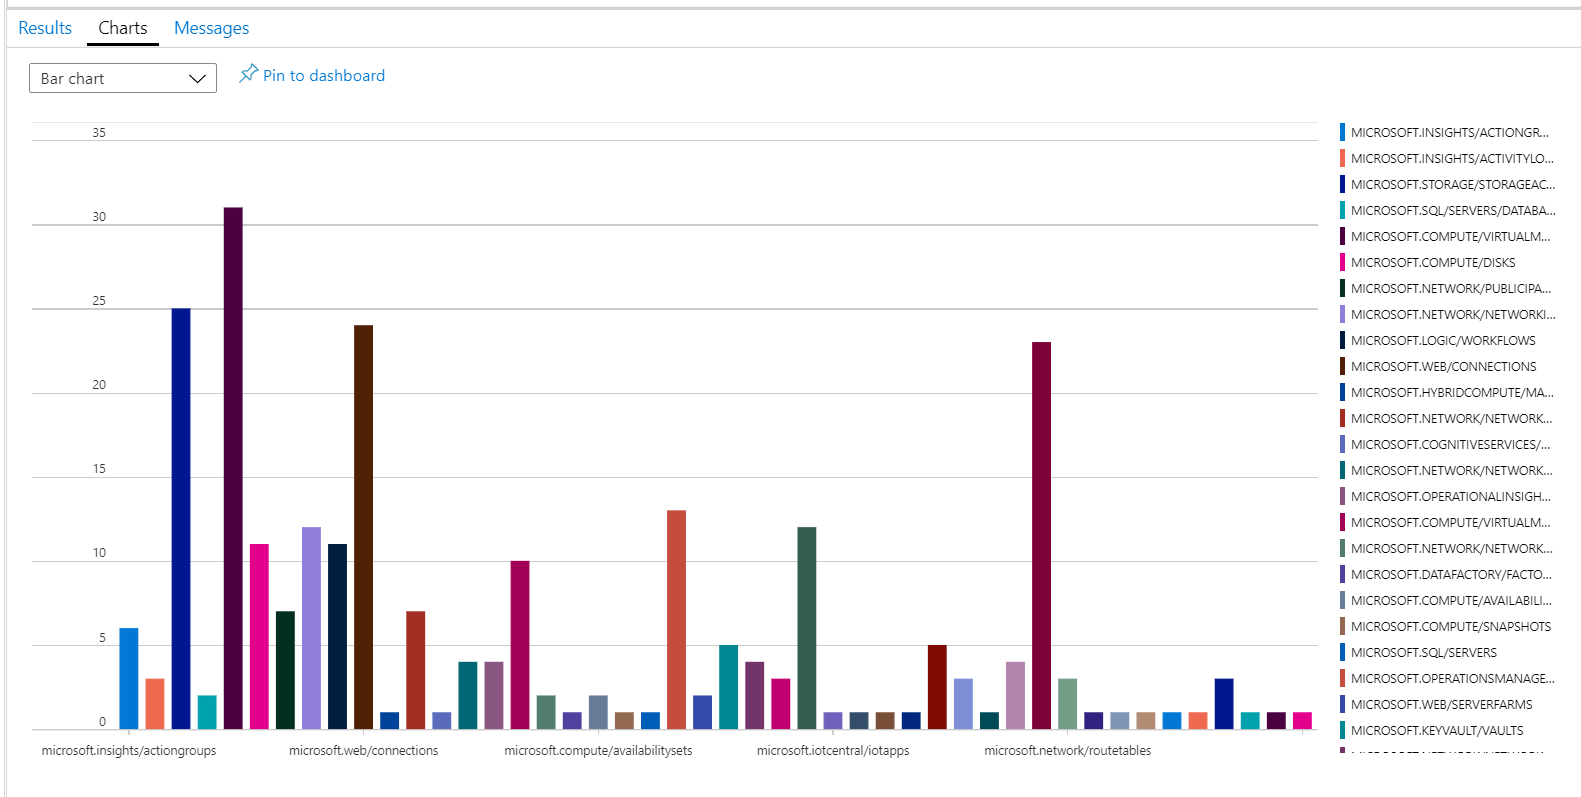
- Select the ‘Charts’ tab in the results output section and select a chart type. I’ll select a ‘Bar chart’ for this example:
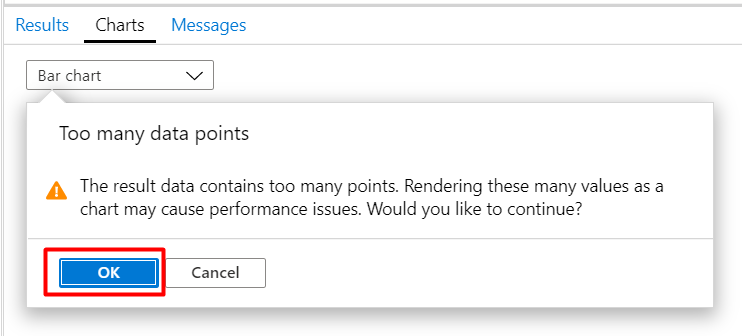
- Sometimes, if ARG knows the requested output may cause some performance issues displaying it, you will be warned about it. You can hit ‘Okay’ just be aware sometimes the results can behave in a lagging fashion.
- Look at the amazing graphical output you now have, visualising your data!
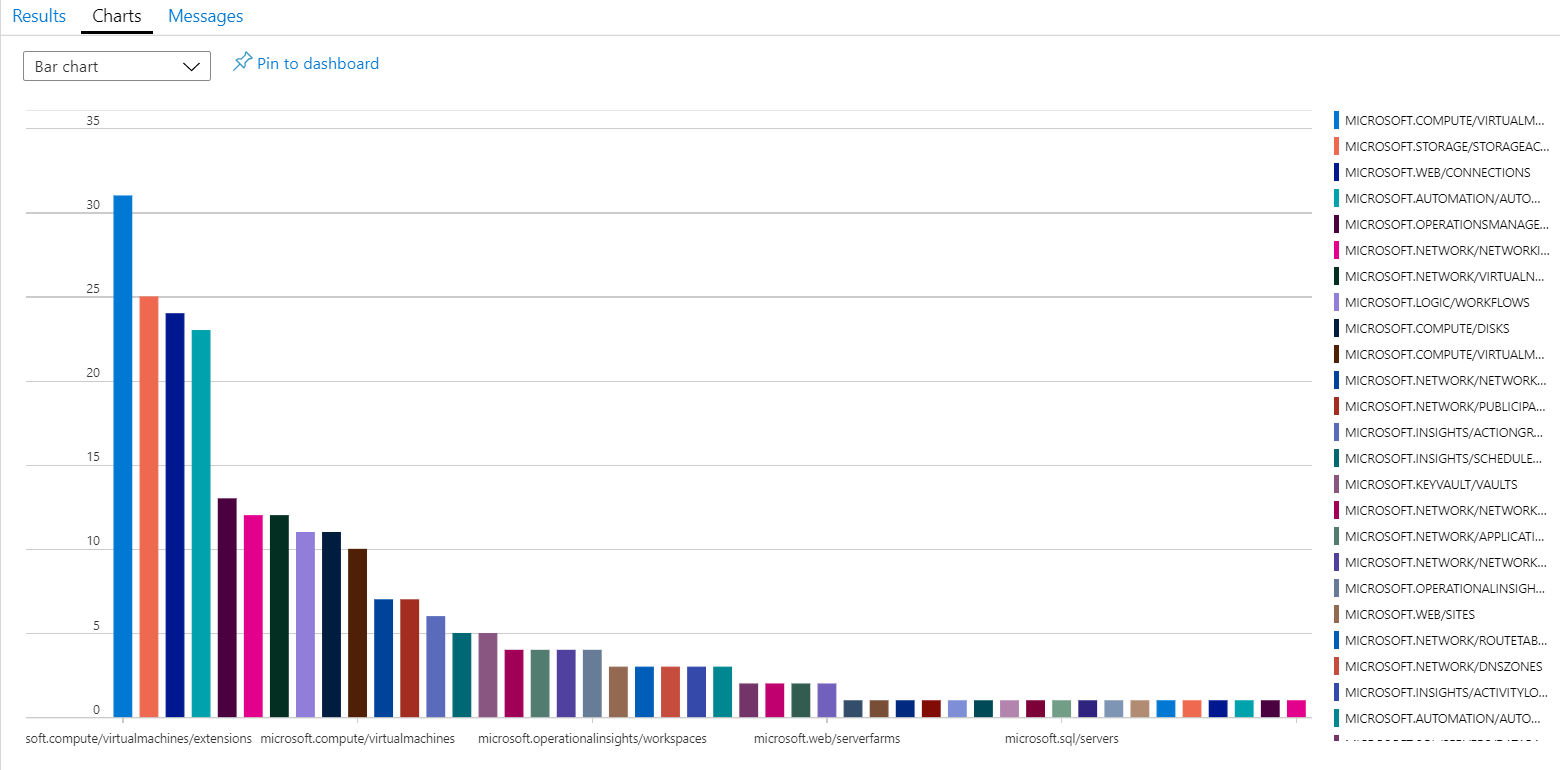
- If you want to sort them in order of most used, just add a new line to the query with " | sort by count_ “, the complete query would be:
Resources
| summarize count() by type
| sort by count_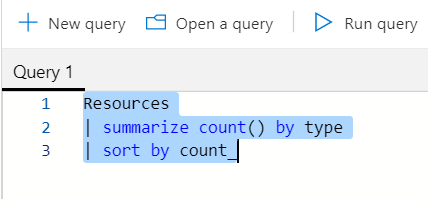
- Re-run the query and look at the bar graph now showing the resource types in order from most to least used
Creating a Dashboard
For the eager eyed readers of this post, you have probably seen the ‘Pin to dashboard’ option in some of the screenshots.
Yes it is that easy to add them the the last viewed dashboard you have, how useful and powerful is that?!
Very helpfully, the Exchange Goddess (Phoummala Schmitt), has shared a pre-created dashboard with the ARG queries all built-in for you all to import and try out. Here is what it looks like on my environment:
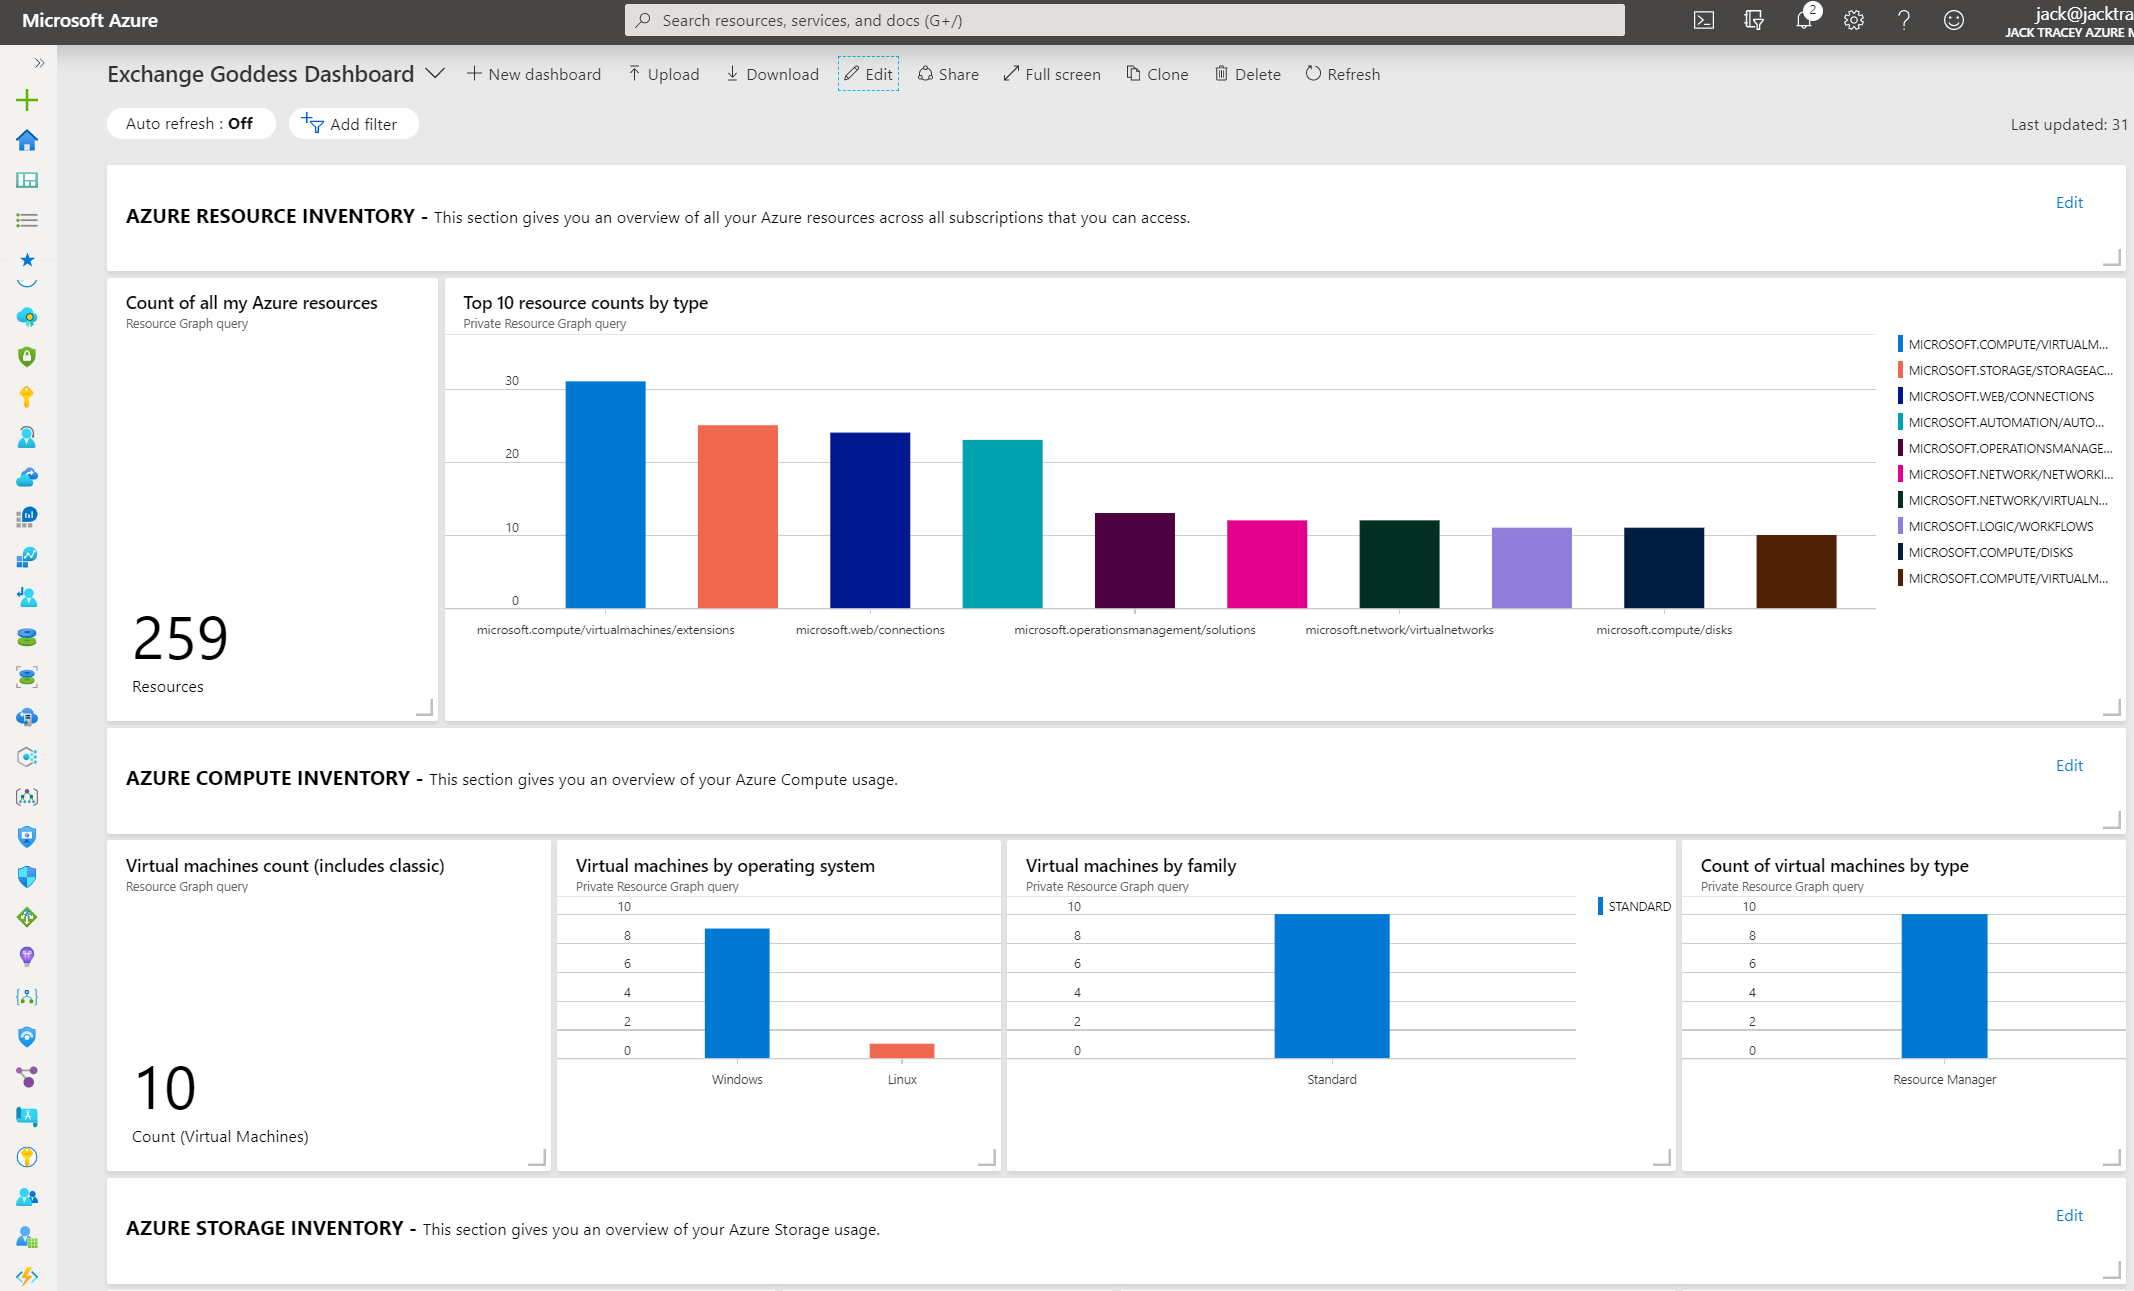
Pretty cool if you ask me!
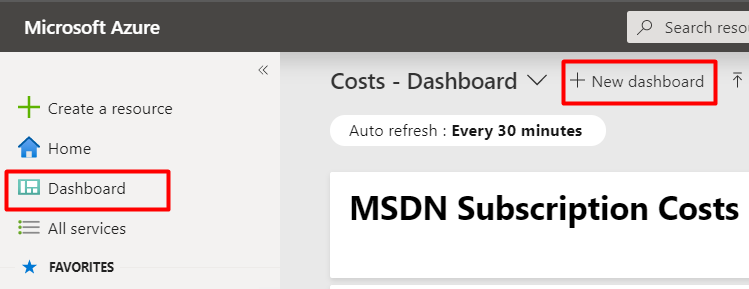
Import The Dashboard For Your Envrionment
- Download the dashboard JSON file from my GitHub Repo
- Create a new Azure Dashboard
- Click ‘Done Customizing’ at the top in purple
- Upload the Exchange Goddess downloaded dashboard you got in step 1, by clicking ‘Upload’ and selecting the file where you saved it to in step 1
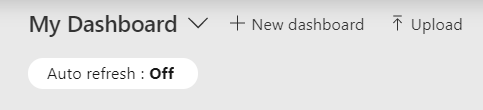
- Done! Magical, right?!
The dashboard will rename itself to ‘Azure Inventory Dashboard’ FYI
All of the ARG queries are in the JSON file, so go open it up in Visual Studio Code and take a look at the queries and amend them to make it more tailored to your requirements!
Summary
Hopefully you now see why I think Azure Resource Graph, is much more powerful than using PowerShell or AZ CLI to query resources and their properties!
The most important thing to remember is that you are not going to delete or change any resources by just playing with Azure Resource Graph Explorer & Queries, it purely is just getting data from the Log Analytics tables it stores that data in as mentioned at the start. So don’t think that you can’t have a go as you don’t know how to use it!
The best way to learn is by doing in my book! Go get querying!
Also I have uploaded some queries that I have created myself for some specific requirements I had that you may find useful to my GitHub Repo. Go check them out.
As always, please comment below if you found this useful or you have any questions. Or reach out to me on Twitter!